How do you start trading stocks with a strategy?
This free course is the result of over 15 years of trading experience. It
will help you become better to trading and make less beginner
mistakes.
- This course is only education and not investment advice.
- Read the terms and disclaimer at the bottom of the page.
- To keep this course free, there are affiliate links on this page.
First of all, you need a plan. This plan consists of a strategy and money management rules so you know when to buy or sell a stock and how much money you can invest (how many shares you can buy).
We use charts to view the price action of
the stock and we use indicators to help us make a decision. With
money management, we determine how much we invest, when we
close eventual losses.
● You need a brokerage account to buy or sell the stocks that are listed
on exchanges. More on that later.
● Please read the terms and disclaimer at the bottom. By using this
class/plan/book/information you indicate that you agree with these
terms and disclaimer.
How to make a Chart?
● Charts are used to visualize the movements of the price of the
shares. We use www.tradingview.com (aff) to make the charts. To
help us make a decision, we use these indicators on the charts:
○ Heikin Ashi candle sticks
○ EMA 20/50/100/200 Exponential Moving Average
○ DMI Directional Movement Index
● Do not let anyone fool you: using more indicators will not give you
more profits! It’s important to keep it simple to avoid doubts. If you
use 100 indicators, you will never get a buy signal from all of them at
the same time. 3 indicators is the maximum. Another indicator we like is Fisher Transform.
● First you open the website www.tradingview.com (aff) where you make an
account. You can use the free account or pay for the premium to get
more features. Now it’s time to make the chart with the parameters
and indicators we want to use.
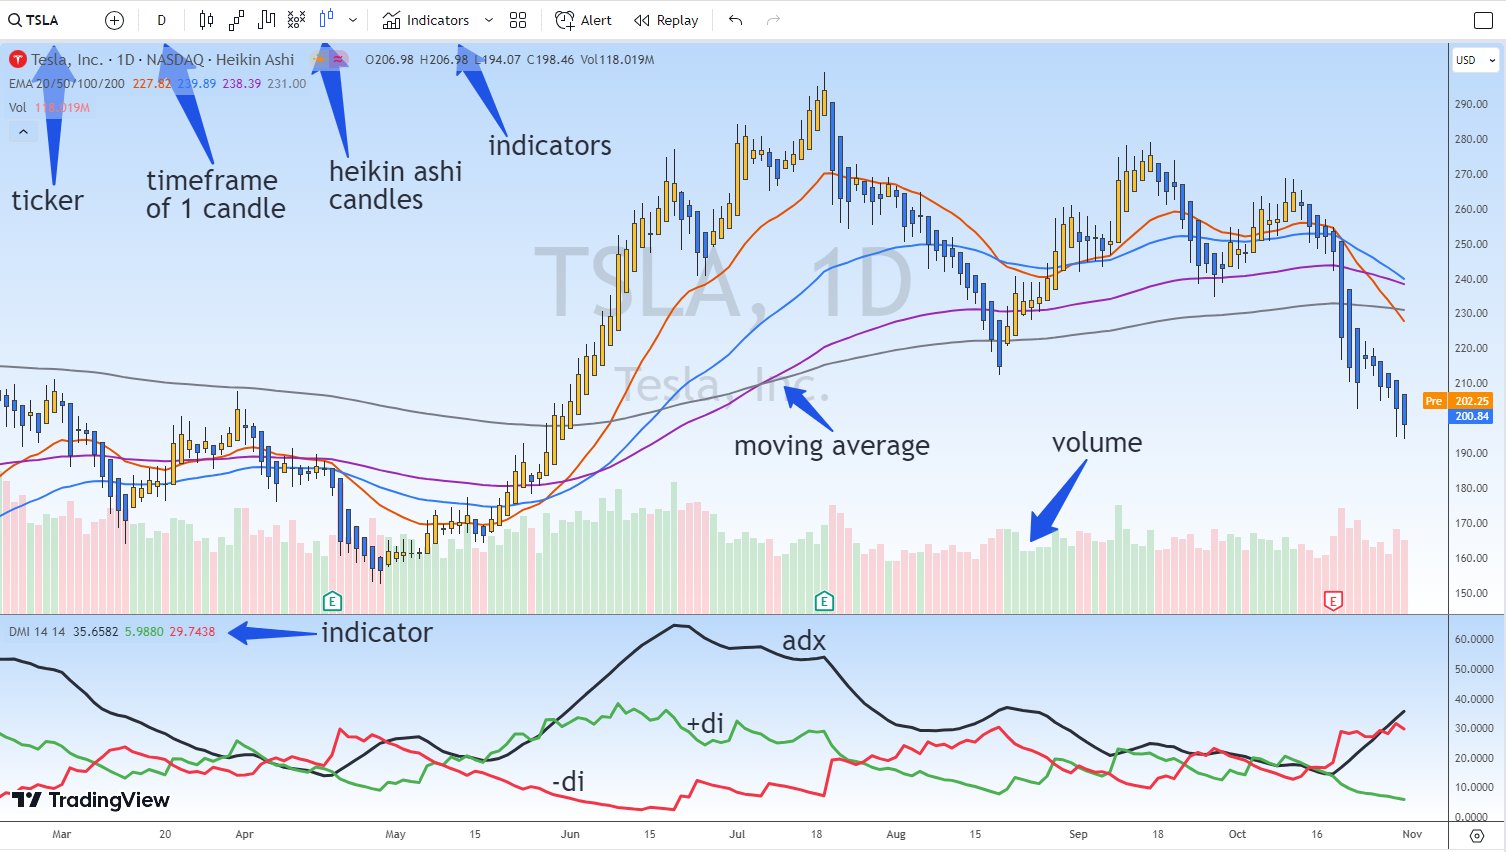
At the top left, you can fill in the name of the company: f.e. Tesla (ticker TSLA)
At the top left, you can choose the “bar’s style”. We use “Heikin Ashi” to get a better view of the trend by
filtering market noise. If you want, you can change the colour of the
bars. We chose yellow and blue instead of green and red because
we can also make money when the stock goes down. So red is not
bad. (a bit of psychology)
As you can see on the image above, you can add indicators to the
chart. First, you can add “EMA 20/50/100/200”. You can adjust the
colour and thickness of every indicator. (gear symbol, top left)
Directional Movement Index is the indicator you can find in ‘indicators’.
Setup: ADX colour black, +Di green and -Di red. Inputs ADX smoothing 14 and Di length 14. You can thicken the lines.
ADX: indicates the strength of the trend.
+Di summarizes upward movement. -Di summarizes downward movement.
Trading signal: buy when +Di is above -Di and ADX starts to rise above 20 and sell when -Di is above +Di and ADX starts to rise above 20. (or the range 18-22)
You can find more about this indicator at
https://www.incrediblecharts.com/indicators/directional_movement.php
● Next to the ticker symbol, you can choose the length of one bar /
candle. Depending on how much time you have and the trades you want
to make, you choose 30 minutes, 1 hour, 3 hours, 1 day or a week. Find what suits you
best. There is no best or worst time frame. With a one-hour time
frame, you have to follow the markets more closely and get more
buy and sell signals. The stock prices on the European exchanges are
delayed by 15 minutes if you have a free account at Tradingview. The
US stocks are in real-time. In the Pro version, you always get real-time
charts.
Chartmill: all data you need to analyze a stock. (aff)
The Rules to buy.
● 50 EMA is rising and 20 EMA is rising more
● Price of the stock is above this 50 EMA line
● Heikin Ashi price candle is rising (so green or the colour you set for rising)
● +Di line is above -Di and ADX turns up above about 20 (range 18-22)
The intention is to stay out of the market when it’s going sideways (ADX is low or declining) or when
the price action is choppy. The rules for closing are explained in Money
Management. If you trade on the 1-hour chart, you should also consider the
3-hour and daily timeframes.
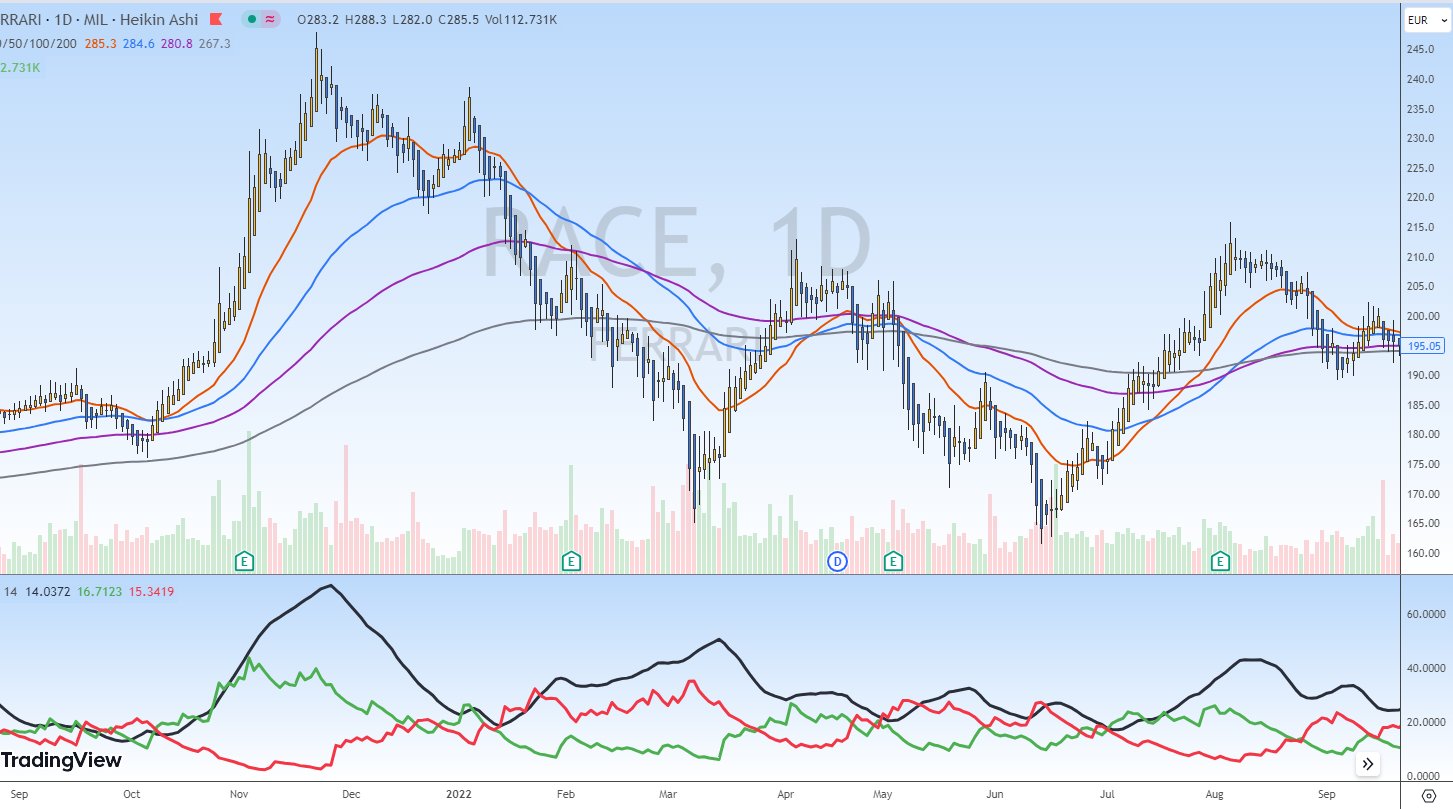
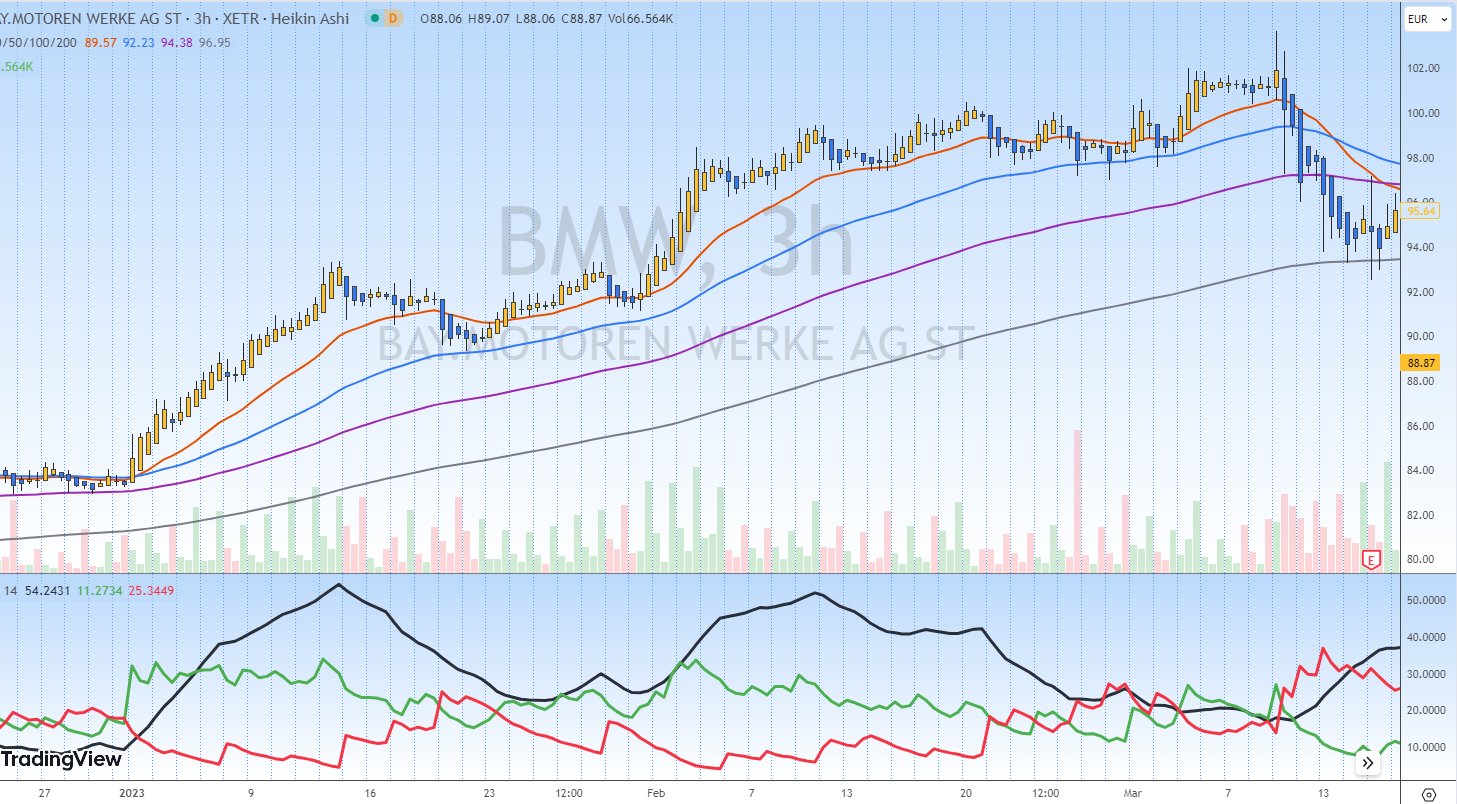
Look at some charts with the setup we explained. The 50 EMA line is blue,
the 20 EMA is red.
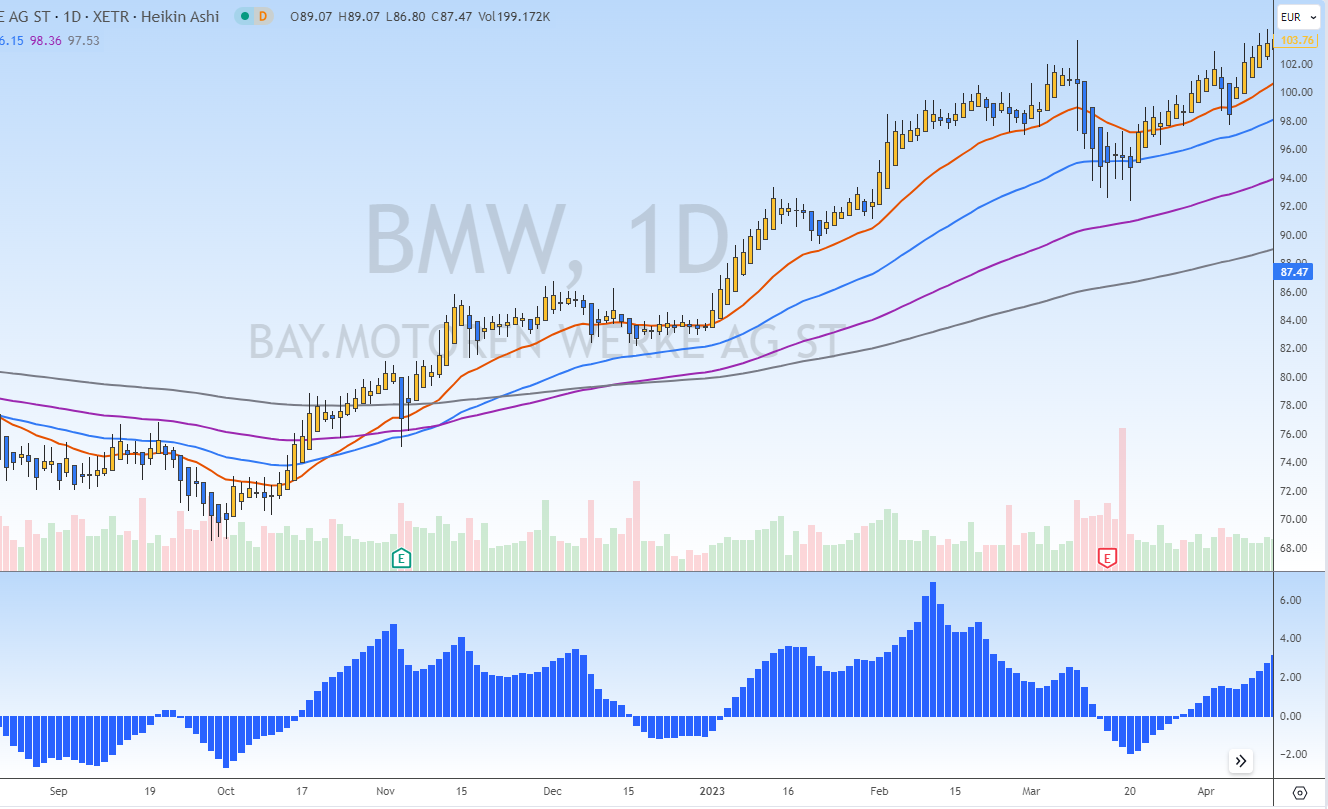
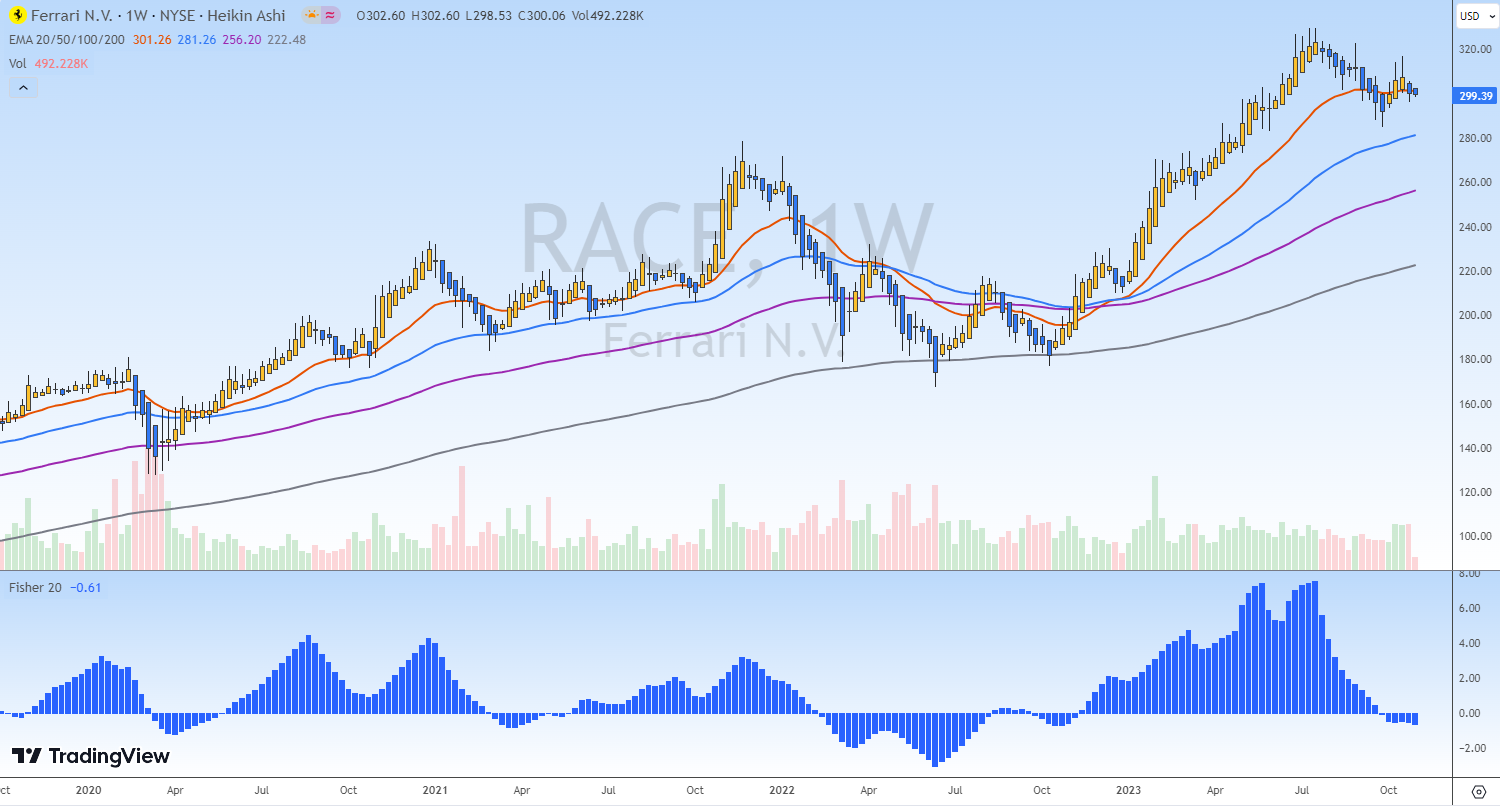
If you don’t like the DME indicator, you can use Fisher Transform instead. You can find more about this indicator at https://www.investopedia.com/terms/f/fisher-transform.asp
We prefer to use a histogram in the style settings and tick off the trigger and horizontal lines. If the histogram exceeds the zero line, this is a buy signal. The EMA lines must also rise. Below are some examples:
Money Management
As an example, we use an available investment amount of 5000 euro
(or usd, gbp). This is risk capital that you will never need again and
therefore willing to lose! You can not make a profit without the risk!
We only use 1/10th of the 5000 in one trade, so 500 euro.
For instance, we buy 10 shares of a stock when the price is 50 euro,
when our indicators allow this to happen. (rules of buying)
Stop loss: It’s important to stop the trade quickly if the price changes
direction. When the rules to buy are no longer in place, f.e. the price
falls below the 50 EMA, you have to sell. When the stock falls more
than 10%, we close the trade anyway. So 500 minus 10% = 450. We
can set the stop loss in the broker’s account software so the trade will
close automatically. When this happens, the loss will be 50 or 1 % of
the capital. (50 of 5000) Exceptionally, a stock may still fall more than
10% at the opening. This is the overnight risk. You cannot rule this
out.
Take profit: It’s important to let the profits run. When the stock is
rising, we let it continue. We look at our indicators to make a
decision. No feelings like: “I think this or that”. So we sell our shares if
one condition occurs:
● The price of the stock falls below the 50 EMA
● When +Di falls below -Di. Or when ADX stops rising.
Chartmill: all data you need to analyze a stock. (aff)
Practical facts and issues
Every stock has a code or ticker. Some stocks are listed in Europe and in
the USA at the same time. These are the tickers that you can use on
Tradingview:
● Ferrari: RACE (Milan) and RACE (USA)
● Porsche AG: P911 (Germany) (IPO Sept 29, 2022)
● Porsche SE Holding: PAH3 (Germany) and POAHY (USA)
● Aston Martin Lagonda: AML (London)
● Daimler: DAI (Germany) and DMLRY (USA)
● BMW: BMW (Germany) and BMWYY (USA)
● Tesla: TSLA (USA)
● Nio: NIO (USA)
● BYD: BY6 (Germany) and BYDDY (USA)
When you buy the pro version of Tradingview, you get real-time charts on
European exchanges. US exchanges have real-time for free.
Porsche AG or Porsche SE? Porsche SE owns 53% of Volkswagen.
Who owns Porsche?
Every company has an ‘investors relations’ website where you can find
news and a calendar of events like quarterly earnings and ex-dividend
dates.
https://www.porsche-se.com/en/investor-relations/
http://corporate.ferrari.com/en/investors
https://www.astonmartinlagonda.com/investors
https://www.bmwgroup.com/en/investor-relations.html
https://www.daimler.com/investors/
Other stocks you can trade in the USA (with ticker): Tesla TSLA, Ford F,
General Motors GM, Rivian RIVN, Lucid LCID, and NIO from China.
Making money when the stock price drops:
When you ‘go short’, you borrow the stock from another trader and
pay interest to him. When the stock goes down, you buy the stock
back on the exchange so you can give it back. Your profit is the
difference between the price you sold and the price you bought. This
strategy is risky because the possible loss is infinite. That’s why we
don’t go short.
A better possibility: you buy a put option or put turbo or short
derivative. These trading products rise when the price of the stock drops. Possibly with
leverage.
In the USA, you can buy Ferrari options. Only buy options or other
derivatives when you understand how they work.
In Germany, you can trade many derivatives on Daimler, BMW and
Porsche. Take a look at
https://www.boerse-stuttgart.de/en/stock-exchange/securities-andmarkets/
to find out more.
We do not recommend trading CFDs.
Make sure you know what the risks are of the instruments you use.
Financial information and news: finance.yahoo.com
When you subscribe to a free account, you can use the watchlist tool to get
all the news and performance of the 5 auto stocks. And you can see all the
financial data like profits and revenue and what the analysts think:
f.e. BMW
finance.yahoo.com/quote/BMW.DE?p=BMW.DE
Brokers
Choose a broker with low rates to buy and sell the stocks. Try not to pay
more than 6 euro/usd per trade. Take a look at degiro.eu, probably they
have the lowest rates in your country (when in Europe) and eoption in the
USA. Search the brokers in your country. (I’m not affiliated with any of them)
Websites
To help you become a good trader quickly, consider using the following
services and tools:
Improve your stock trading edge with data:
www.marketchameleon.com (aff)
Gives you a lot of data to see what’s going on in the markets.
Charts for technical analysis:
www.tradingview.com (aff)
All data you need to analyze a stock: fundamental report, TA report, Earnings estimates, charts, analysts, financials ans more: www.Chartmill.com
This course is free for you but a lot of work was done to create it. The only
revenue is through affiliate partnerships with good trading websites we like.
Valuable Facts and Trading Experience
We give you this valuable experience so you don’t make beginner’s
mistakes:
Trading is a business, the same effort is needed as in starting a business
or career.
Do not try to predict the stock market, no one can consistently. Look for a
statistical advantage with indicators / technical analysis.
These are entry points with a statistical probability that the course
continues to move in the same direction.
Do not try to buy at the bottom and sell at the top but buy high and sell even
higher. Go with the trend.
Take profit (the profit of a successful trade) must be much larger than your
stop-loss (the loss of a failed trade). At least double or more. (= profit / loss
ratio)
This allows you to make a profit even if less than 50% of your trades are
winners.
If your winning trades are 4 times larger than your lost traces, only 20% of
all trades must be winners to break even (formula: (100-80) / 20 = 4). With
a profit / loss ratio of 2, more than 33% of all your trades must be winners.
(100-33) /33=2.03
The larger the profit-loss ratio, the fewer trades will be winners. (which is
not a problem because the losses are small)
Systems with a profit ratio of 70% or more do not exist. Sooner or later
they lose all profits with a few positions.
Look at the losses like the costs of a company, they are part of trading and
are not your fault.
Trading is like tennis: the winner also makes mistakes, and does not know
what’s going to happen and must be mentally strong.
Do not use a complicated strategy. Keep it simple. Many indicators (> 3) =
more delay in the decision to buy or sell.
Trading = making decisions with imperfect information.
The loss of 1 trade may not exceed 2% of your available capital.
Protecting your capital is more important than making a profit. So keep the
stop-loss small.
Most people are usually right at the wrong time and take profits too quickly.
Do not average down.
Only take the trades with the most chances of success according to your
strategy.
Wait for the trades with the most potential (like a hunter) and use these
opportunities if the market rewards you.
The psychological aspect is more important during trading than your
trading strategy. The human brain and instinct are not made to trade. Fear
and greed make it difficult to carry out your trading plan with discipline.
I hope this helps to become a better trader.
Terms and Disclaimer
By using this class/plan/book/information you indicate that you agree with these terms
and disclaimer. The information in this book has nothing to do with getting rich quickly.
Trading takes dedication and commitment, success does not happen overnight. Results
are not guaranteed and may vary from person to person. There are inherent risks
involved with trading, including the loss of your investment. Past performance in the
market is not indicative of future results. Any investment is solely at your own risk, you
assume full responsibility. Online Wave publishes information that is educational in
nature and designed to contribute to your overall understanding of various types of
technical analysis and how we apply this information to the financial markets. We are in
no way recommending the purchase, sale or short sale of any securities, options,
futures or other financial instruments. Trading of stocks, options, futures, and currency
markets may not be suitable for everyone and may involve the risk of losing part of your
money, all of your money, or in the case of futures, more than all of your money.
This publication is designed to provide accurate and authoritative information in regard
to the subject matter covered. It is sold with the understanding that the publisher is not
engaged in rendering legal, accounting, or other professional services. If you require
legal advice or other expert assistance, you should seek the services of a competent
professional.
Under no circumstances does the information in this book represent a recommendation
to buy or sell stocks or funds. It should not be assumed that the methods presented in
this book will be profitable or that they will not result in losses. Past results are not
necessarily indicative of future results. Examples in this book are for educational
purposes only. We are not a Financial Advisor or Registered Analyst. We do not offer
our various model portfolios as trading recommendations for you to copy. These models
represent our own accounts and/or opinions and are intended to teach our style of
investing and trading. It is up to you to make your own decisions as what you want to do
with your own portfolio. Trading of stocks, options, futures, or currencies may not be
suitable for everyone. Equities, Futures, Options, and Currency trading and investing
have large potential for rewards, but also large potential risk. You must be aware of the
risks and be willing to accept them in order to invest in the Equities, Futures, Options,
and Currency markets. Absolutely do not trade with money you cannot afford to
lose.You should carefully consider whether trading is suitable for you in light of your
circumstances, knowledge and financial resources. Absolutely consult your Registered
Financial Advisor and your Risk Trading Plan before ever investing or trading any
financial instrument! We shall under no circumstances be liable for any lost profits, lost
opportunities, misstatements, or errors contained within these pages. You also agree
that we will not be held liable for data accuracy, server problems, or any special or
consequential damages that result from the use of, or the inability to use, any or all of
the materials published on our Website. You agree to hold everyone at Online Wave
harmless for any act resulting directly or indirectly from this site, its data, content,
materials, associated pages and documents.
Affiliates: we use affiliate links, meaning we get a commission if you decide to purchase
through these links, at no additional cost to you. Understand we try to educate you but
I’m doing this as a for-profit business and much effort was required to write this guide.
We do our best to keep things fair and balanced in order to assist you in making the
best decision for you.
Copyright © 2018-2025 Online Wave Belgium. Belgian law applies to this ebook, our
website, information and education. In the event of a dispute, only the courts of the
district of Antwerp have jurisdiction in the Dutch language.
All rights reserved. No part of this publication may be reproduced, stored in a retrieval
system or transmitted in any form or by any means, electronic, mechanical,
photocopying, recording, or otherwise without the prior written permission of the
copyright holder.